Here is the MG close to our favourite kite-boarding spots Langebaan and Shark Bay. This was taken at the mill house close to the local Club Mykonos casino.


Here is the MG close to our favourite kite-boarding spots Langebaan and Shark Bay. This was taken at the mill house close to the local Club Mykonos casino.
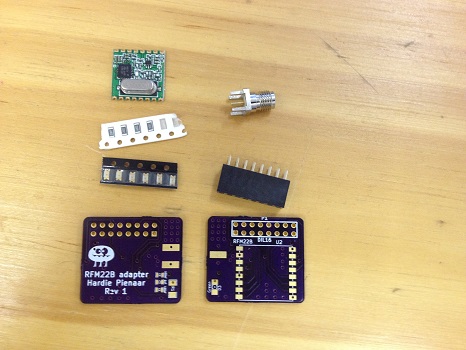
After about 3 weeks the Raspberry Pi RFM22B has arrived. The boards have been soldered and tested. There is some setup needed to get the SPI interface working, this is all explained at the top of some example code I am attaching at the bottom of this post. I built a total of 3 of these boards, each with a differently tuned RFM22B board. These boards are being used on my Quad copter as a small lightweight spectrum analyzer. I have attached both the code that I am currently using to drive the modules as well as a .zip file which can be directly submitted to Oshpark for fabrication. If you manage to try it, let me know how it works for you. The code I have written at the moment only covers setting the frequency, IF filter and pre-amp and allows the programmer to request the current RSSI level. I have also attached a LED which is directly connected to the GPIO pins just to play with.
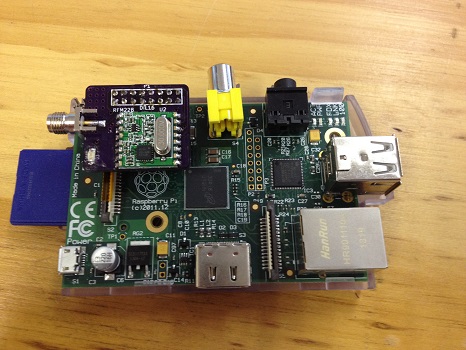
Board mounted on GPIO port of Raspberry Pi
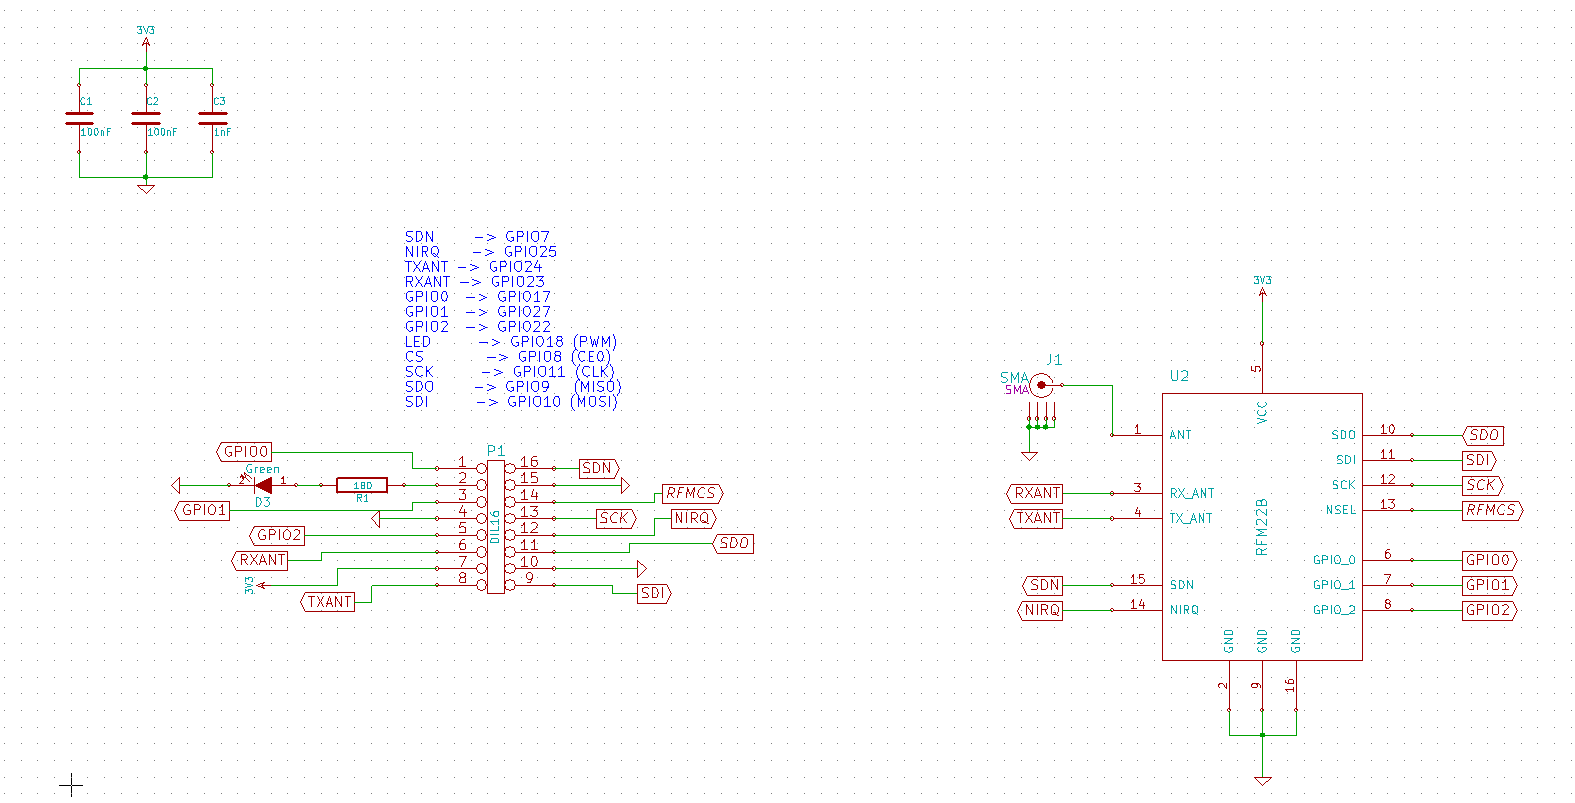
Schematic
The 32-bit spectrum analyzer has been used for multiple tasks in its prototype form. However, it has been decided to slightly change the final design. This choice is motivated mainly by the application I am using for my Master’s degree. Therefore, this is the end of the development for the 32-bit analyzer and the birth of the raspberry-pi analyzer. The specification will be much the same as previously listed, however, the micro-controller will be replaced with the raspberry pi which will communicate directly to the RFM22B chip via its own SPI channels. The software will all be written in python and will have much the same functionality as my current 32bit spectrum analyzer design.
In the meantime, I will attach the MPLAB project file and python source code used to interface with the device below. The MPLAB project file clearly lists the pin allocations which eliminates the need for a schematic. Finally, see the board layout for the raspberry pi spectrum analyzer board ordered from OSHPark.
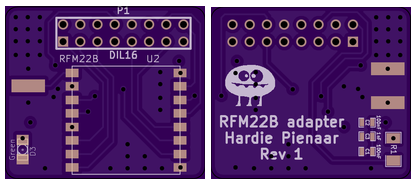
Top and bottom board layout of new raspberry pi spectrum analyser
MPLab project for 32 bit spectrum analyser
Python interface code for host PC
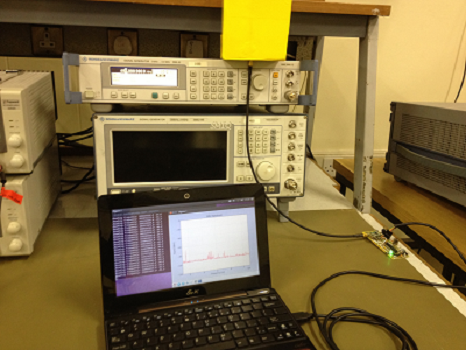
Note that this was not by far a final design of the code, there are still many small bug fixes and streamlining needed, for example, the communication protocol between the device and host still needed to be sent bytewise and not by character, however, feel free to use it for experimentation. Below is a photo of the 32 Bit spectrum analyzer measuring a sweep with a resistively loaded monopole antenna built by my colleague, Matthew Groch.
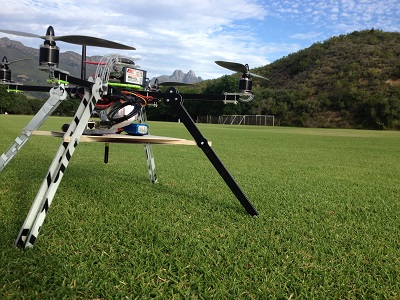
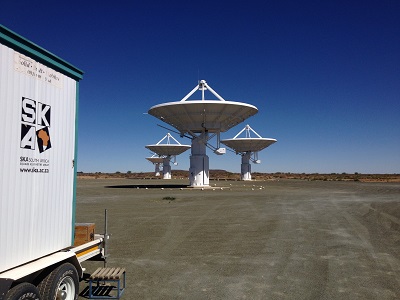
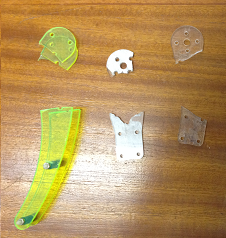
With a lot of help from a friend, Johan Frank, new legs and a platform was built for the quad copter. These legs allow for an antenna to be mounted below a platform supporting a spectrum analyzer and single board computer. This platform was specifically built for a measurement campaign at the SKA site which turned out very successful.
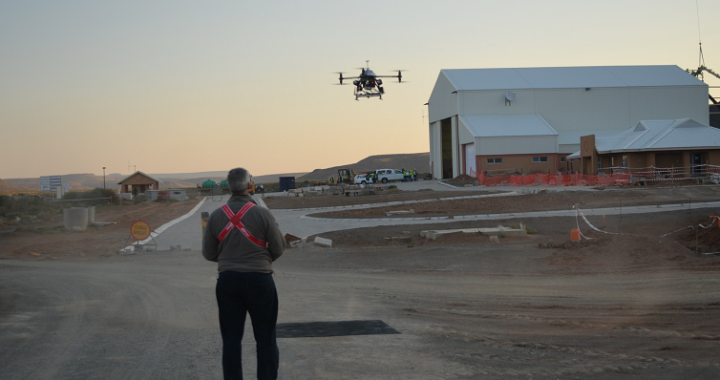
The RF shielding effect of a berm was measured using a Multi-copter as part of my PhD program. LS of SA from LS telecom generously helped us with these measurements with their own Multi-copter measurement platform. The measurements were done with a transmitter located on the far side of the berm transmitting 9 vertically polarized frequencies, from 60m, directly at the berm. Below is a photo of the Multi-copter measuring in the vicinity of the berm.
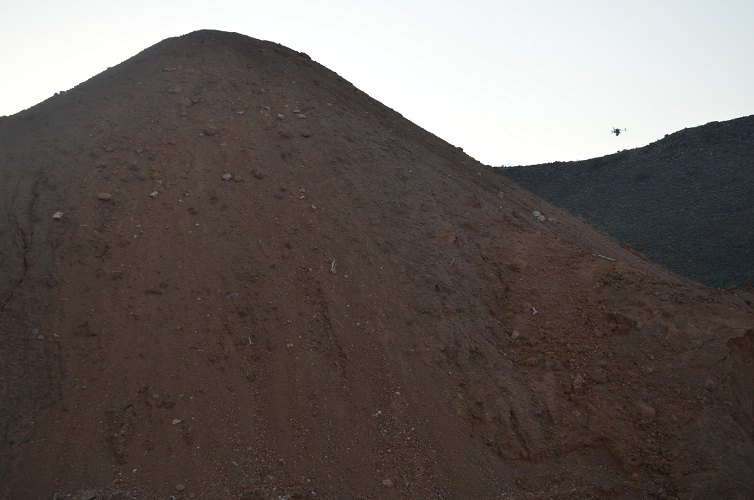
Far side of berm, opposite side than transmitter
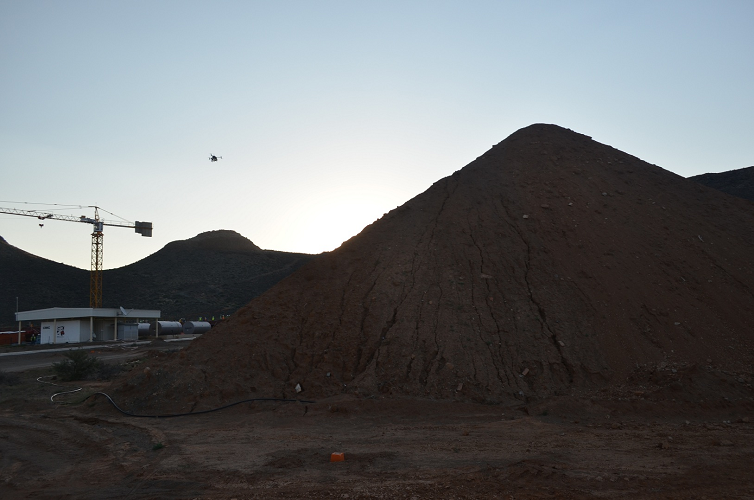
Front side of berm, same side as transmitter
The data was then processed and compiled together from a total of 7 10 min flights at different heights and configurations. The processed data was plotted and interpolated with python on a 2D grid with an overlay of the berm. The next 3 clips shows animations of the interpolated data over different frequencies and heights.
Final Word
I would just like to thank the measurement team and especially LS of SA for the great collaboration.
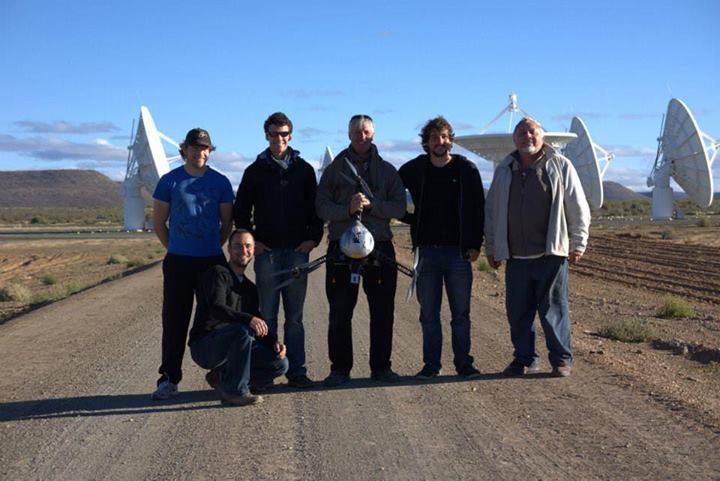
From the left:
Mathew Groch: Responsible for broadband loaded dipole antenna used in these measurements
Jan (crouching) from LS of SA
Nardus Mathyssen responsible for developing a pulse generator which will be used in future measurements
Wessel from LS of SA
Myself Hardie Pienaar
Brian from LS of SA
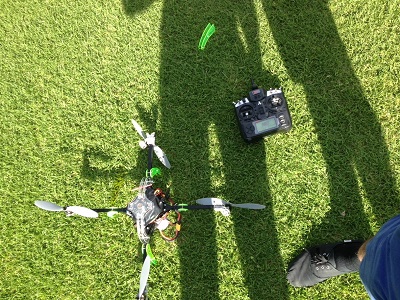
After flying in loiter mode for a while the quad-copter suddenly flipped over. I immediately switched to Stabilize mode and increased throttle in an attempt to save the situation. It stabilized itself just before hitting the ground but sadly had too much horizontal velocity. As a result, the quadcopter snagged and rolled in spectacular fashion. The damage was two motor mounts and a landing gear. The cause of the flip: bad connection to one of thESC’s’s from the APM 2.5 output.

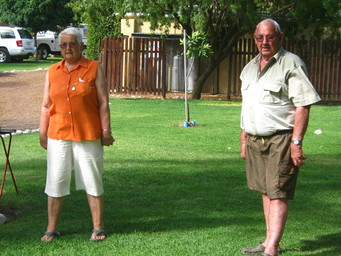
In the beginning of 2011 my grandfather gave me his 1968 MG midget MK III. The car is still in almost perfect condition as can be seen in the photo taken in Stellenbosch. I will dedicate this part of my webpage to give updates on my MG. The bottom photo shows my grandmother and grandfather playing bowls.

Upgraded to the APM 2.5. Height and GPS accuracy are significantly better than the APM 1.0. The APM 2.5 also has a much higher telemetry data throughput due to some of the signal processing happening off of the Atmel chip. Below is a photo of the new neat setup containing the APM 2.5.
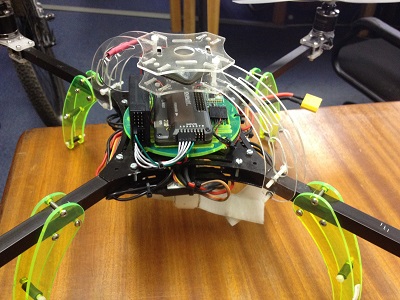
APM 2.5 setup

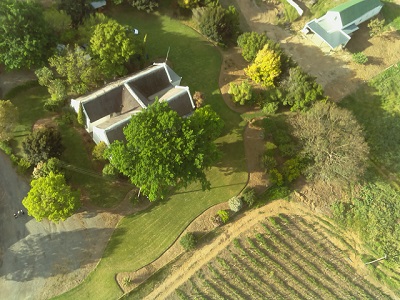
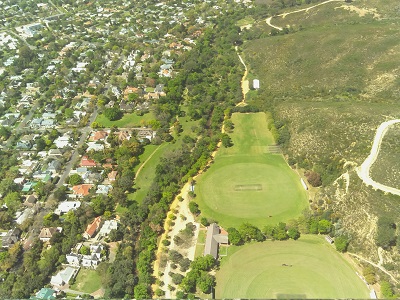
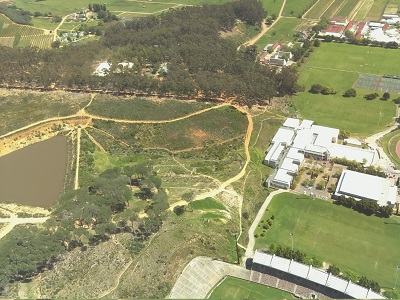
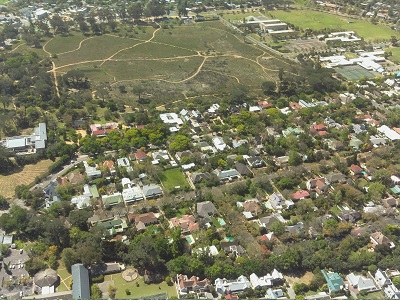
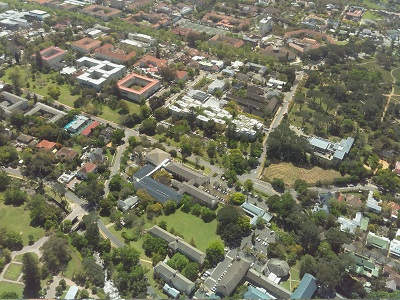
After receiving my raspberry pi camera, I thought it to be a good idea to take some aerial photos with the quadcopter. The first few photos are from Stellenbosch University campus followed by the last few which are from a farm near Worcester, South Africa.
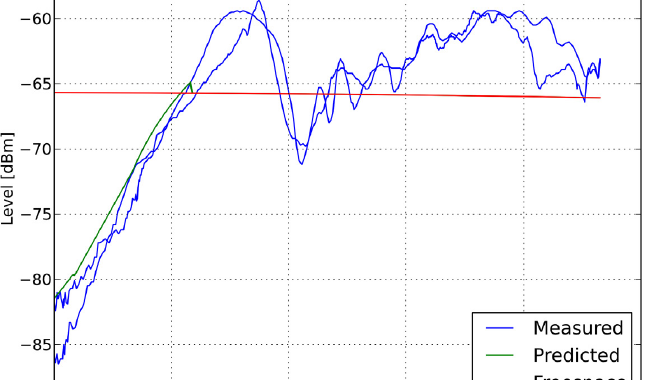
After getting the quadcopter to fly in loiter and auto missions with confidence, it was decided to use the quadcopter for measuring RF signal propagation. This measurement was done with a transmitter on one side of a 13m high human-made berm. Flying a vertical path up to 50m on the far side measuring the diffraction of the continuous wave signal at 400MHz. Below is a video with the payload strapped to the quadcopter, note that the antenna (yellow block) was exchanged for a small stub antenna during the actual measurement. The measurement was done using my RS232 spectrum analyser logging onto a Raspberry Pi. The effect of the quadcopter on the antenna pattern was ignored, and the measured data were treated as relative. The measured data can be seen in the featured image and resembles a diffraction pattern. This pattern has been verified against some prediction code of a colleague. As a first test, this proved very successful as a proof of concept and was hereafter named fEMu (flying Electromagnetic Metrology unit).