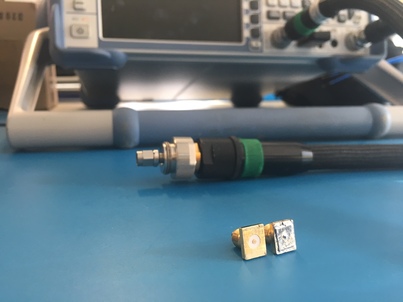
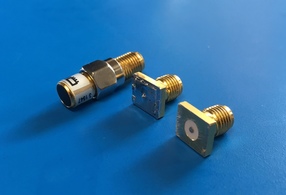
As a follow up to my previous post, I built some simple SMA dielectric probes using PCB edge mount connectors. The probe interface surface is rather rough and the short was made using some soldered copper tape. This is definitely not the ideal set of probes. Nevertheless, I was curious how the probe would compare to its simulated counterpart. All of the dimensions were measured as accurately as possible using a set of digital callipers. The measurements were done on a VNA seen in the photo below.

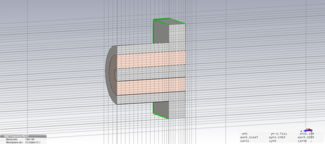
A cross-section of the mesh and model used in CST Microwave Office:

The rest of the post is the Jupyter Notebook that I used to analyse the measurements and simulation. I attempted to calibrate the probe parameters but still found too large of a difference between the measurement and simulation to use it in an actual permittivity extraction. In order to properly calibrate the probe, we definitely need a well-characterised reference material.
Probe Set Investigation
Import Measurement and Simulation data
# Define function to extract measurements data
import csv
import numpy as np
def read_s1p(filename):
    """
    Arguments:
    filename - filename including directory to measurement file.

    Returns
    freq - Measured frequency in Hz
    s11 - Measured scattering parameters in linear complex form
    """
    freq = []
    s11 = []
    with open(filename, 'r') as csvfile:
        reader = csv.reader(csvfile, delimiter=' ', quotechar='|')
        for row in reader:
            row = list(filter(None, row))
            if len(row) == 3:
                freq.append(float(row[0]))
                s11.append(float(row[1]) + 1j*float(row[2]))
        freq = np.array(freq)
        s11 = np.array(s11)
        return freq, s11
Lets import all of our measurements and simulations using the read_s1p function
freq, s11_open = read_s1p("measurements/open.s1p")
freq, s11_short = read_s1p("measurements/short.s1p")
freq_cst, s11_open_cst = read_s1p("measurements/cst_open.s1p")
freq_cst, s11_short_cst = read_s1p("measurements/cst_short.s1p")
freq_cst, s11_open_cst_shifted = read_s1p("measurements/cst_open_shifted.s1p")
# Convert the CST frequency from GHz to Hz
freq_cst = freq_cst*1e9
Lets compare our probe-set measurements to their ideal simulation using CST Microwave Studio
import matplotlib.pyplot as plt

# Define S11 plotting function
def plt_s11(freq, s11):
    plt.subplot(1, 2, 1)
    plt.plot(freq/1e6, 20*np.log10(np.abs(s11)))
    plt.plot(freq/1e6, 20*np.log10(np.abs(s11)))
    plt.xlim(freq[0]/1e6, freq[-1]/1e6)
    plt.ylim(-1,0.1)
    plt.xlabel("Freq [MHz]")
    plt.ylabel("S11 [dB]")
    plt.grid(True)
    plt.subplot(1, 2, 2)
    plt.plot(freq/1e6, np.angle(s11)*180/np.pi)
    plt.plot(freq/1e6, np.angle(s11)*180/np.pi)
    plt.xlim(freq[0]/1e6, freq[-1]/1e6)
    plt.ylim(-180,180)
    plt.xlabel("Freq [MHz]")
    plt.ylabel("S11 [Deg]")
    plt.grid(True)

# Plot Open
fig = plt.figure(figsize=(20, 4))
fig.suptitle("Open", fontsize=16)
plt_s11(freq, s11_open)
plt_s11(freq_cst, s11_open_cst)

# Plot Short
fig = plt.figure(figsize=(20, 4))
fig.suptitle("Short", fontsize=16)
plt_s11(freq, s11_short)
plt_s11(freq_cst, s11_short_cst)

plt.show()
The phase of both simulations match up well with their measurements. However, the short does have a substantial amount of loss across the entire band. This is most likely due to the copper tape that was used to create the short.
Shifting the Reference Plane to the Probe Interface
Using the open probe, which matched well with the simulation, we will add a phase offset to shift the reference plane from the connector to the probe interface.
l = 7.49e-3 # Distance from connector to probe interface
eps_r_teflon = 2.1 # Permittivity of teflon in coax
wavelength = 3e8/(freq)
vf = 1/np.sqrt(eps_r_teflon)
phase_offset = 2*np.pi*((2*l)/wavelength)/vf

# Apply the phase offset to all frequencies
s11_open_ref = s11_open*np.exp(1j*phase_offset)

# Plot the result compared to the simulated phase shifted result
fig = plt.figure(figsize=(20, 4))
fig.suptitle("Open Phase Shifted", fontsize=16)
plt_s11(freq, s11_open_ref)
plt_s11(freq_cst, s11_open_cst_shifted)
plt.ylim(-5,5)
plt.show()
Compared with the simulation the phase is about 1 degree off at the highest frequencies. This translates to geometrical errors in the submilimeter range. Polishing the end of the probe might improve this result.
Probe Capacitance and Radiating Conductance
Using the phase shifted measurement, we can calculate the probe calibration parameters.
e_c = 1 - 1j*0 # Permittfivity of a vacuum

# Define some parameters
w = 2*np.pi*freq
Z0 = 50
Y0 = 1/Z0

# Calculate the admittance of the air
Y = Y0*(1-s11_open_ref)/(1+s11_open_ref)

# Calculate the probe parameters
# Calculate A and B terms
A = 1j*w*e_c
B = np.power(e_c,5/2)

# Calculate the probe parameters
G_0 = (np.real(A)*np.imag(Y) - np.real(Y)*np.imag(A))/(np.real(A)*np.imag(B) - np.real(B)*np.imag(A))
C_0 = (np.imag(Y) - np.imag(B)*G_0)/np.imag(A)

# Plot the probe parameters
fig = plt.figure(figsize=(20, 4))
plt.subplot(1, 2, 1)
plt.plot(freq/1e6, G_0)
plt.xlim(freq[0]/1e6, freq[-1]/1e6)
plt.xlabel("Freq [MHz]")
plt.ylabel("$G_0$")
plt.title("Radiating Conductance")
plt.grid(True)
plt.subplot(1, 2, 2)
plt.plot(freq/1e6, C_0)
plt.xlim(freq[0]/1e6, freq[-1]/1e6)
plt.xlabel("Freq [MHz]")
plt.ylabel("$C_0$")
plt.title("Fringing Capacitance")
plt.grid(True)
plt.show()
print("Fringing capacitance: "+str(np.average(C_0[1:])))
print("Radiating Conductance: "+str(np.average(G_0[1:])))
Measurement:
Fringing capacitance: 1.64773857969e-14
Radiating Conductance: 5.34207558123e-06
Simulation:
Fringing capacitance: 3.27689464957e-14
Radiating Conductance: 8.31421262357e-07
We find that only 1 degree in phase gives us double the fringing capacitance and almost 10 times less conductance. We are also ignoring losses in the short piece of coax transmission line in the probe. As a result, we really do need a good reference material to calibrate the probe. Just using a simulation and callipers will not be enough.
