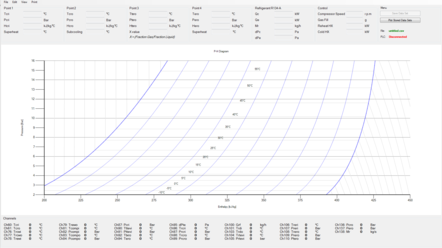
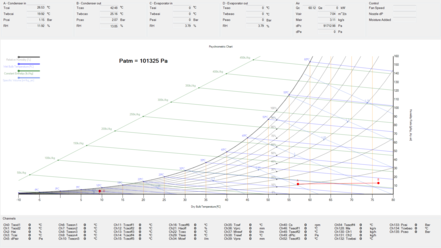
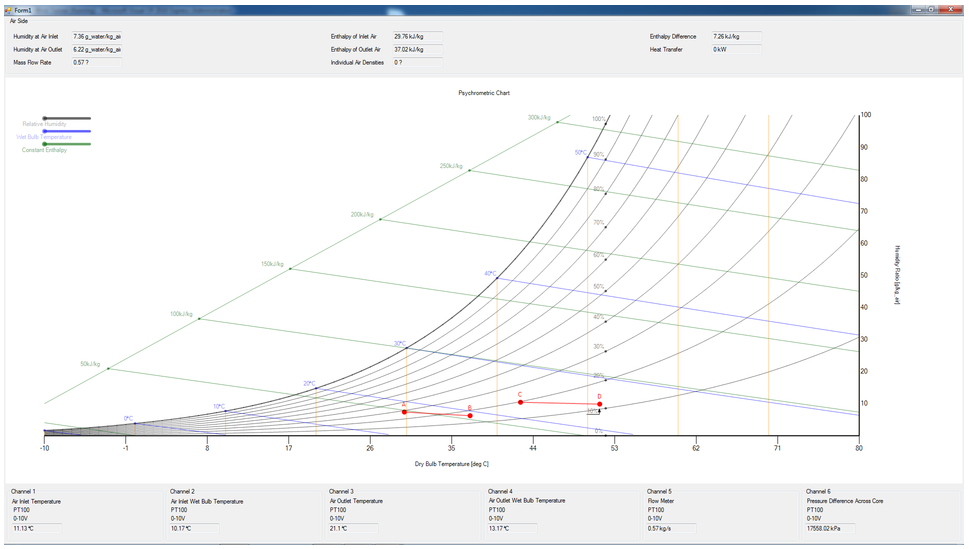
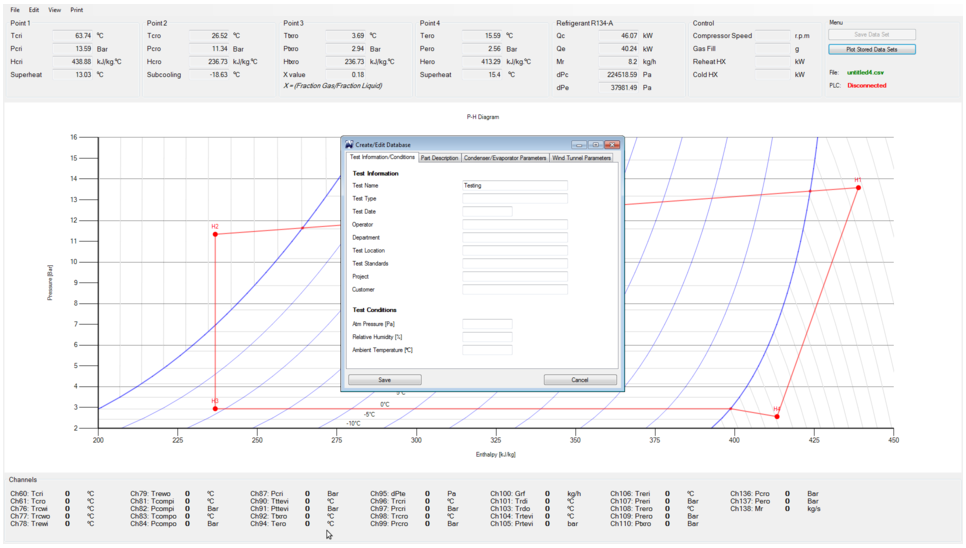
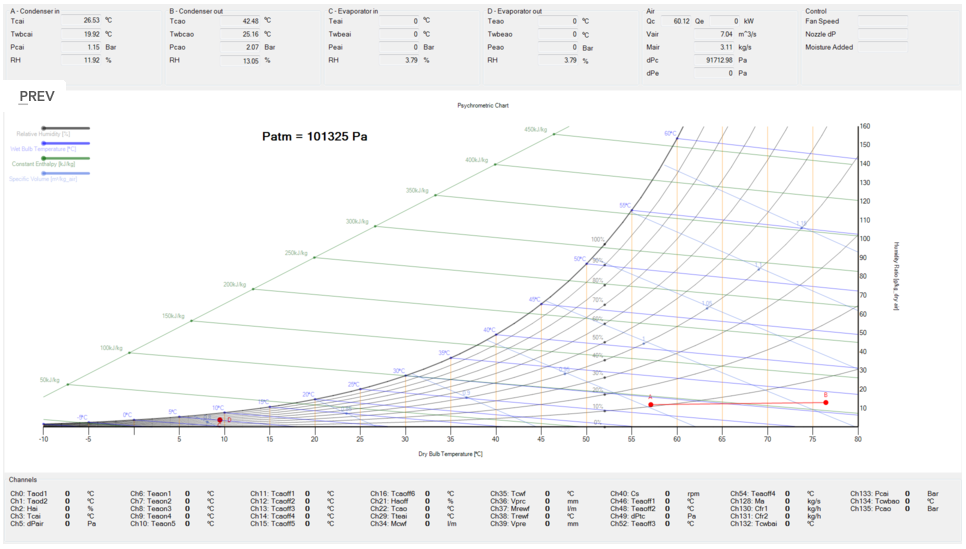
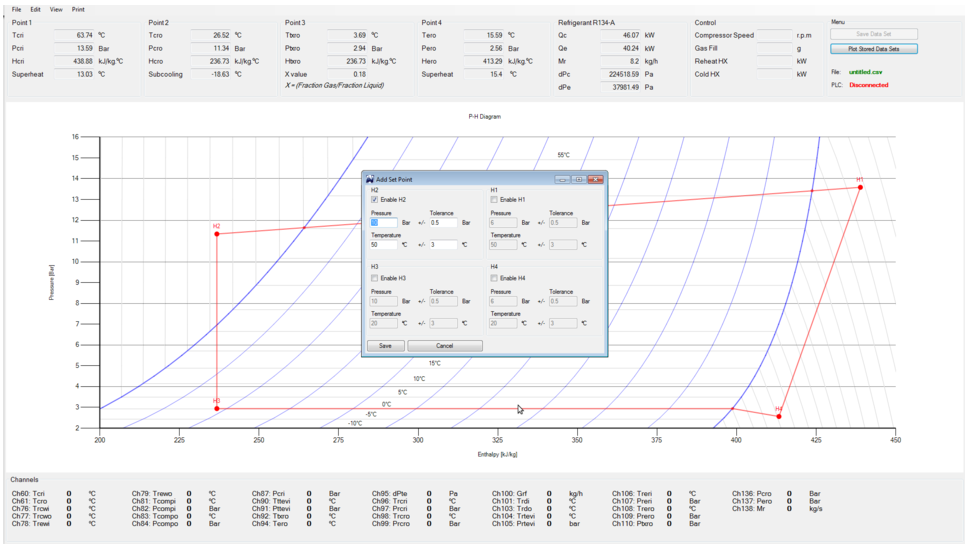
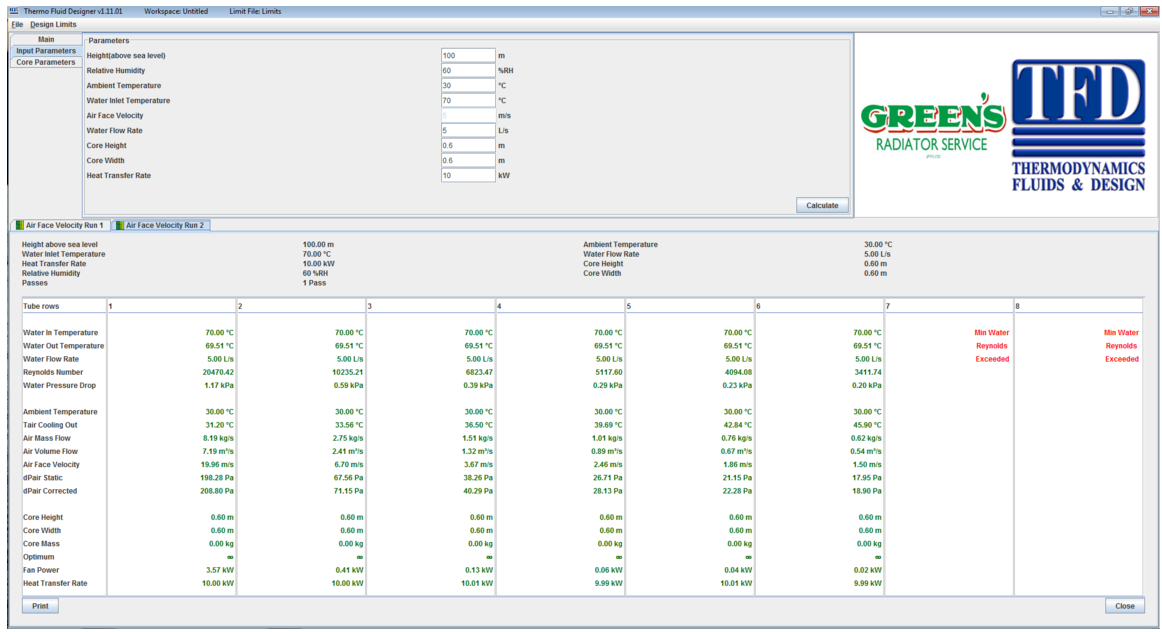
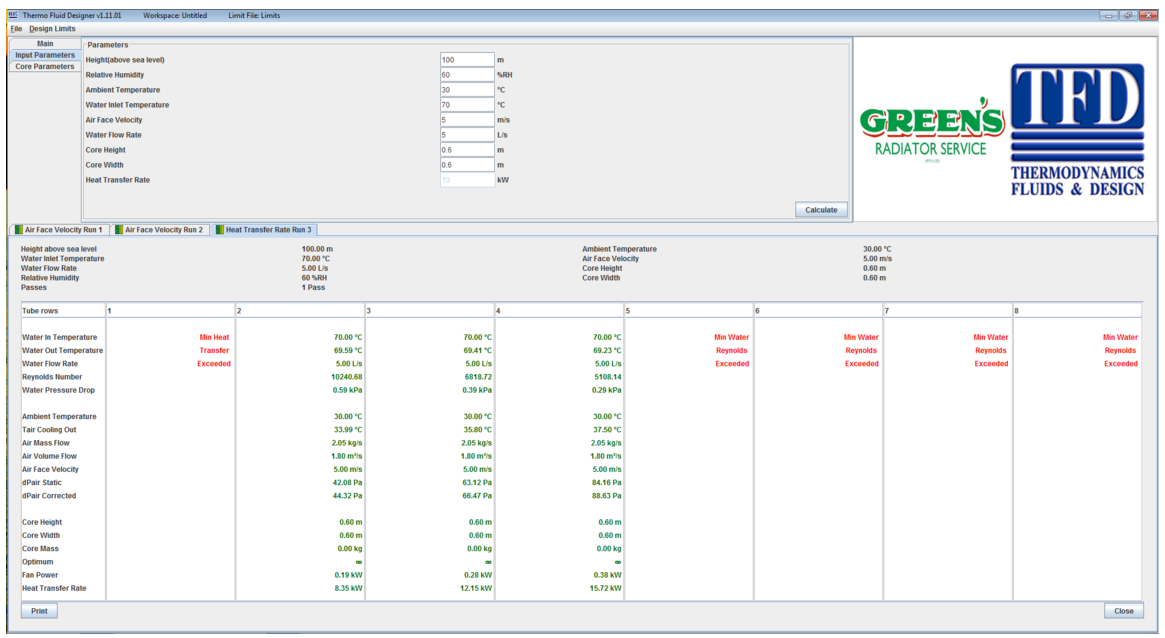
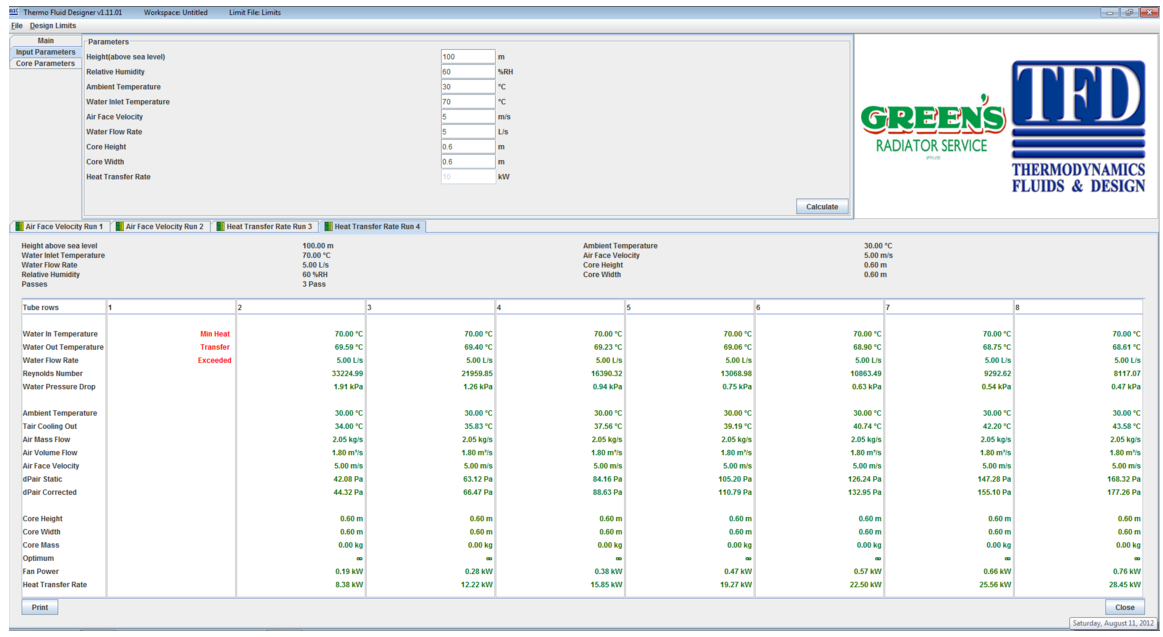
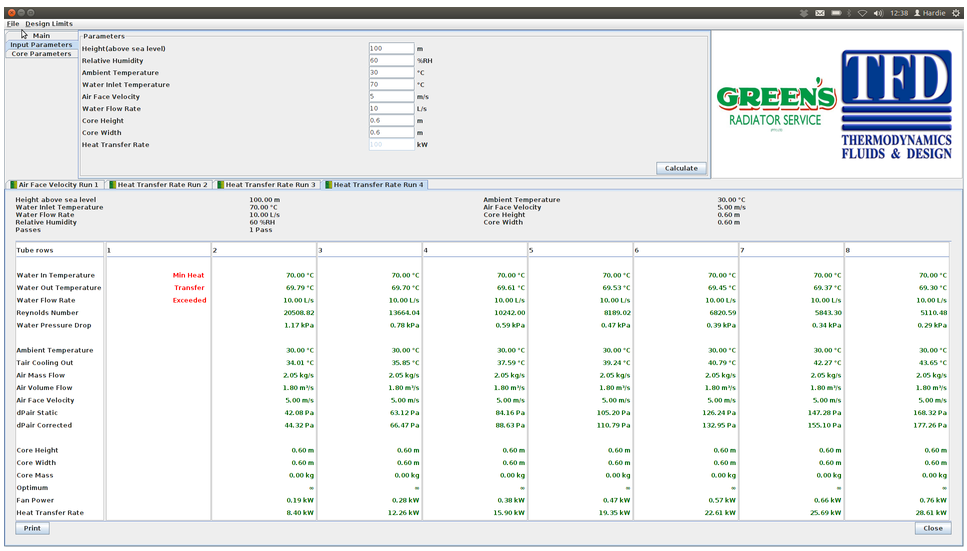
This project was done by myself for a company called TFDesign, the software is in phase 1 at the moment and is capable of reading data from a Siemens PLC, processing the data with some thermodynamic libraries and finally plotting the data on a psychometric and pressure-enthalpy graph. The software has extra functionality such as the saving of points, saving the current workspace and fading points to show the trend of the graphs. This project was written in C#. This project, however, is not open source, so I can only offer screenshots.
The project software has the capability to set certain “set points”, save current data as well as generate performance plots with the saved data. The set points is for the user to know where he wants the data points to move to. When at these certain set points the user can save the data to be later used in generating performance plots. The software starts on 2 HD resolution screens and immediately starts plotting the data read from the PLC.
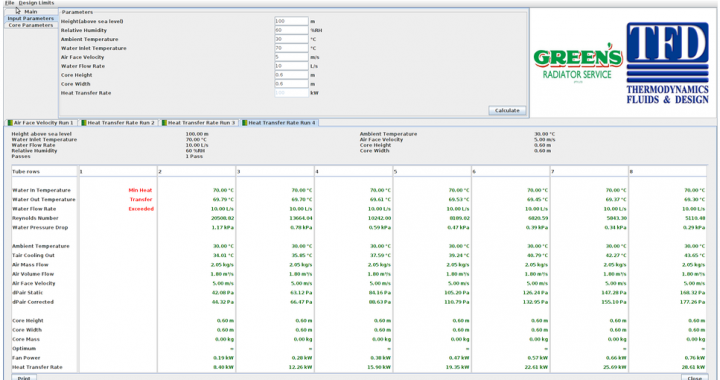
Here are a few more screenshots. This was my first big commercial programming project which turned out quite well. The program is still in use at 2 facilities and has been handed over to the company for small updates and maintenance.
